 |
OpenMS
2.7.0
|
 |
OpenMS
2.7.0
|
TOPPView offers three types of views – a 1D view for spectra, a 2D view for peak maps and feature maps, and a 3D view for peak maps. All three views can be freely configured to suit the individual needs of the user.
All three views share a similar interface. Three action modes are supported – one for translation, one for zooming and one for measuring:
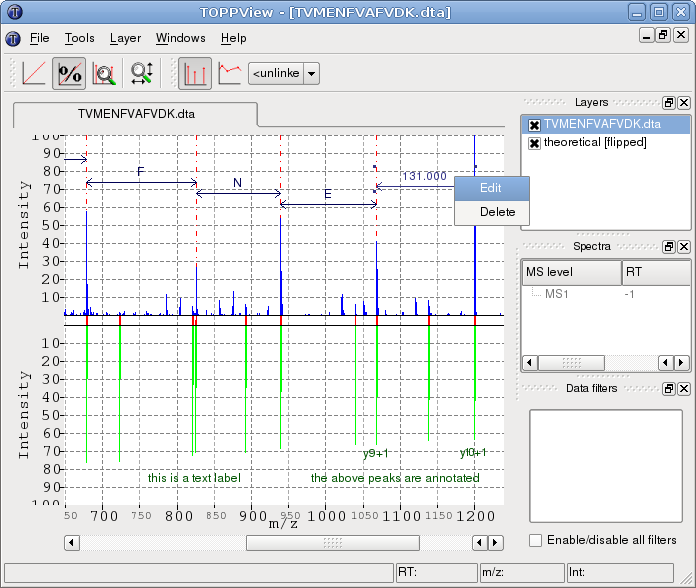
The 1D view is used to display raw spectra or peak spectra. Raw data is displayed using a continuous line. Peak data is displayed using one stick per peak. The color used for drawing the lines can be set for each layer individually. The 1D view offers a mirror mode, where the window is vertically divided in halves and individual layers can be displayed either above or below the "mirror" axis in order to facilitate quick visual comparison of spectra. When a mirror view is active, it is possible to perform a spectrum alignment of a spectrum in the upper and one in the lower half, respectively. Moreover, spectra can be annotated manually. Currently, distance annotations between peaks, peak annotations and simple text labels are provided.
The following example image shows a 1D view in mirror mode. A theoretical spectrum (lower half) has been generated using the theoretical spectrum generator (Tools > Generate theoretical spectrum ). The mirror mode has been activated by right-clicking the layer containing the theoretical spectrum and selecting Flip downward from the layer context menu. A spectrum alignment between the two spectra has been performed (Tools > Align spectra ). It is visualized by the red lines connecting aligned peaks and can be reset through the context menu. Moreover, in the example, several distances between abundant peaks have been measured and subsequently replaced by their corresponding amino acid residue code. This is done by right-clicking a distance annotation and selecting Edit from the context menu. Additionally, peak annotations and text labels have been added by right-clicking peaks and selecting Add peak annotation or by right-clicking anywhere and selecting Add label, respectively. Multiple annotations can be selected by holding down the CTRL key while clicking them. They can be moved around by dragging the mouse and deleted by pressing DEL.

Through the context menu: of the 1D view you can:
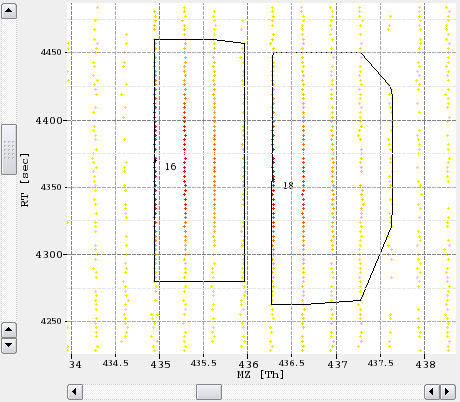
The 2D view is used to display peak maps and feature maps in a top-down view with color-coded intensities. Peaks and feature centroids are displayed as dots. For features, also the overall convex hull and the convex hulls of individual mass traces can be displayed. The color gradient used to encode for peak and feature intensities can be set for each layer individually.
The following example image shows a small section of a peak map and the detected features in a second layer.

In addition to the normal top-down view, the 2D view can display the projections of the data to the m/z and RT axis. This feature is mainly used to assess the quality of a feature without opening the data region in 3D view.
Through the context menu: of the 2D view you can:
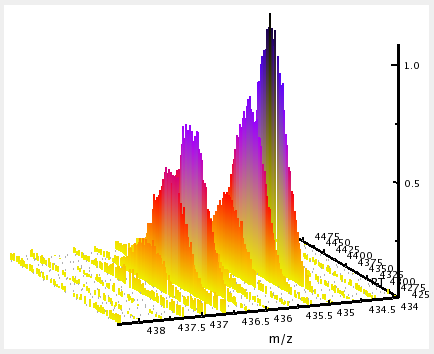
The 3D view can display peak maps only. Its primary use is the closer inspection of a small region of the map, e.g. a single feature. In the 3D view slight intensity differences are easier to recognize than in the 2D view. The color gradient used to encode peak intensities, the width of the lines and the coloring mode of the peaks can be set for each layer individually.
The following example image shows a small region of a peak map:

Through the context menu: of the 3D view you can:
 1.9.1
1.9.1