|
OpenMS
|
Canvas for visualization of one or several spectra. More...
#include <OpenMS/VISUAL/Plot1DCanvas.h>
Public Types | |
| enum | LabelMode { LM_XABSOLUTE_YABSOLUTE , LM_XPERCENT_YABSOLUTE , LM_XABSOLUTE_YPERCENT , LM_XPERCENT_YPERCENT } |
| Label modes (percentage or absolute) of x axis and y axis. More... | |
| enum | DrawModes { DM_PEAKS , DM_CONNECTEDLINES } |
| Enumerate all available paint styles. More... | |
 Public Types inherited from PlotCanvas Public Types inherited from PlotCanvas | |
| enum | ActionModes { AM_TRANSLATE , AM_ZOOM , AM_MEASURE } |
| Mouse action modes. More... | |
| enum | IntensityModes { IM_NONE , IM_PERCENTAGE , IM_SNAP , IM_LOG } |
| Display modes of intensity. More... | |
| typedef LayerDataBase::ExperimentType | ExperimentType |
| Main data type (experiment) | |
| typedef LayerDataBase::ExperimentSharedPtrType | ExperimentSharedPtrType |
| Main managed data type (experiment) | |
| typedef LayerDataBase::ConstExperimentSharedPtrType | ConstExperimentSharedPtrType |
| typedef LayerDataBase::ODExperimentSharedPtrType | ODExperimentSharedPtrType |
| typedef LayerDataBase::FeatureMapType | FeatureMapType |
| Main data type (features) | |
| typedef LayerDataBase::FeatureMapSharedPtrType | FeatureMapSharedPtrType |
| Main managed data type (features) | |
| typedef LayerDataBase::ConsensusMapType | ConsensusMapType |
| Main data type (consensus features) | |
| typedef LayerDataBase::ConsensusMapSharedPtrType | ConsensusMapSharedPtrType |
| Main managed data type (consensus features) | |
| typedef ExperimentType::SpectrumType | SpectrumType |
| Spectrum type. | |
| typedef SpectrumType::ConstIterator | SpectrumConstIteratorType |
| Spectrum iterator type (iterates over peaks) | |
| typedef SpectrumType::PeakType | PeakType |
| Peak type. | |
| using | RangeType = RangeAllType |
| a generic range for the most common units | |
| using | AreaXYType = Area< 2 >::AreaXYType |
| The range of data shown on the X and Y axis (unit depends on runtime config) | |
| using | VisibleArea = Area< 2 > |
| The visible range of data on X and Y axis as shown on plot axis (not necessarily the range of actual data, e.g. no data to show). | |
| using | GenericArea = Area< 2 > |
| A generic range of data on X and Y axis as shown on plot axis. | |
| using | PixelArea = Area< 2 > |
| using | UnitRange = RangeAllType |
| using | PointOnAxis = DimMapper< 2 >::Point |
Public Slots | |
| void | activateLayer (Size layer_index) override |
| void | removeLayer (Size layer_index) override |
| void | updateLayer (Size i) override |
| void | horizontalScrollBarChange (int value) override |
| Public Slots inherited from PlotCanvas | |
| void | changeVisibility (Size i, bool b) |
| change the visibility of a layer | |
| void | changeLayerFilterState (Size i, bool b) |
| change if the defined data filters are used | |
| void | showGridLines (bool show) |
| Whether or not to show grid lines. | |
| void | setVisibleArea (const VisibleArea &area) |
| Sets the visible area. | |
| void | setVisibleArea (const RangeAllType &area) |
| Sets the visible area. | |
| void | setVisibleArea (const AreaXYType &area) |
| Sets the visible area. | |
| void | setVisibleAreaX (double min, double max) |
| Set only the visible area for the x axis; other axes are untouched. | |
| void | setVisibleAreaY (double min, double max) |
| Set only the visible area for the y axis; other axes are untouched. | |
| void | saveCurrentLayer (bool visible) |
| Saves the current layer data. | |
| virtual void | horizontalScrollBarChange (int value) |
| Notifies the canvas that the horizontal scrollbar has been moved. | |
| virtual void | verticalScrollBarChange (int value) |
| Notifies the canvas that the vertical scrollbar has been moved. | |
| void | setAdditionalContextMenu (QMenu *menu) |
| Sets the additional context menu. If not 0, this menu is added to the context menu of the canvas. | |
| virtual void | updateLayer (Size i)=0 |
Updates layer i when the data in the corresponding file changes. | |
| AreaXYType | canvasPixelArea () const |
| Get the Area in pixel coordinates of the current canvas for X and Y axis. | |
| const DimMapper< 2 > & | getMapper () const |
| Get Mapper to translate between values for axis (X/Y) and units (m/z, RT, intensity, ...) | |
| void | setMapper (const DimMapper< 2 > &mapper) |
| Set a new mapper for the canvas. | |
Signals | |
| void | showCurrentPeaksAs2D () |
| Requests to display all spectra in 2D plot. | |
| void | showCurrentPeaksAs3D () |
| Requests to display all spectra in 3D plot. | |
| void | showCurrentPeaksAsIonMobility (const MSSpectrum &spec) |
| Requests to display this spectrum (=frame) in ion mobility plot. | |
| void | showCurrentPeaksAsDIA (const Precursor &pc, const MSExperiment &exp) |
| Requests to display all spectra as DIA. | |
| Signals inherited from PlotCanvas | |
| void | layerModficationChange (Size layer, bool modified) |
| Signal emitted whenever the modification status of a layer changes (editing and storing) | |
| void | layerActivated (QWidget *w) |
| Signal emitted whenever a new layer is activated within the current window. | |
| void | layerZoomChanged (QWidget *w) |
| Signal emitted whenever the zoom changed. | |
| void | visibleAreaChanged (const VisibleArea &area) |
| Change of the visible area. | |
| void | sendCursorStatus (const std::string &x_value, const std::string &y_value) |
| Emitted when the cursor position changes (for displaying e.g. in status bar) | |
| void | sendStatusMessage (std::string message, OpenMS::UInt time) |
Emits a status message that should be displayed for time ms. If time is 0 the message should be displayed until the next message is emitted. | |
| void | recalculateAxes () |
| Forces recalculation of axis ticks in the connected widget. | |
| void | updateVScrollbar (float f_min, float disp_min, float disp_max, float f_max) |
| Triggers the update of the vertical scrollbar. | |
| void | updateHScrollbar (float f_min, float disp_min, float disp_max, float f_max) |
| Triggers the update of the horizontal scrollbar. | |
| void | changeLegendVisibility () |
| Toggle axis legend visibility change. | |
| void | actionModeChange () |
| Emitted when the action mode changes. | |
| void | preferencesChange () |
| Emitted when the layer preferences have changed. | |
Public Member Functions | |
| Plot1DCanvas (const Param &preferences, const DIM gravity_axis=DIM::Y, QWidget *parent=nullptr) | |
| Default constructor. | |
| ~Plot1DCanvas () override | |
| Destructor. | |
| const LayerData1DBase & | getLayer (Size index) const |
| LayerData1DBase & | getLayer (Size index) |
| const LayerData1DBase & | getCurrentLayer () const |
| LayerData1DBase & | getCurrentLayer () |
| const DimBase & | getGravityDim () const |
| Get the dimension on which gravity is currently acting upon (usually it's the Y axis' unit) | |
| const DimBase & | getNonGravityDim () const |
| Get the dimension on which gravity is currently not acting upon (the orthogonal axis; usually it's the X axis' unit) | |
| bool | addChromLayer (ExperimentSharedPtrType chrom_exp_sptr, ODExperimentSharedPtrType ondisc_sptr, OSWDataSharedPtrType chrom_annotation, const int index, const std::string &filename, const std::string &basename, const std::string &basename_extra) |
| DrawModes | getDrawMode () const |
| Returns the draw mode of the current layer. | |
| void | setDrawMode (DrawModes mode) |
| Sets draw mode of the current layer. | |
| void | showCurrentLayerPreferences () override |
| Shows the preferences dialog of the active layer. | |
| bool | flippedLayersExist () |
| Returns whether flipped layers exist or not. | |
| void | flipLayer (Size index) |
Flips the layer with index up/downwards. | |
| bool | mirrorModeActive () const |
| Returns whether this widget is currently in mirror mode. | |
| void | setMirrorModeActive (bool b) |
| Sets whether this widget is currently in mirror mode. | |
| void | dataToWidget (const DPosition< 2 > &peak, QPoint &point, bool flipped=false) |
| For convenience - calls dataToWidget. | |
| void | dataToWidget (const DPosition< 2 > &xy_point, DPosition< 2 > &point, bool flipped) |
| For convenience - calls dataToWidget. | |
| void | dataToWidget (double x, double y, QPoint &point, bool flipped=false) |
| Calls PlotCanvas::dataToWidget_(), takes mirror mode into account. | |
| PointXYType | widgetToData (const QPoint &pos) |
| For convenience - calls widgetToData. | |
| PointXYType | widgetToData (double x, double y) |
| Calls PlotCanvas::widgetToData_(), takes mirror mode into account. | |
| void | dataToWidgetDistance (double x, double y, QPoint &point) |
| converts a distance in axis values to pixel values | |
| PointXYType | widgetToDataDistance (double x, double y) |
compute distance in data coordinates (unit axis as shown) when moving x/y pixel in chart/widget coordinates | |
| virtual const RangeType & | getDataRange () const override |
| overload to call the 1D version (which has min-intensity of '0') | |
| template<class T > | |
| void | pushIntoDataRange (T &data_point, const int layer_index) |
| Pushes a data point back into the valid data range of the current layer area. Useful for annotation items which were mouse-dragged outside the range by the user. | |
| void | pushIntoDataRange (PointXYType &xy_unit, const int layer_index) |
| Pushes a data point back into the valid data range of the current layer area. Useful for annotation items which were mouse-dragged outside the range by the user. | |
| void | setTextBox (const QString &html) |
| Display a static text box on the top right. | |
| Annotation1DItem * | addPeakAnnotation (const PeakIndex &peak_index, const QString &text, const QColor &color) |
| --— Annotations | |
| void | performAlignment (Size layer_index_1, Size layer_index_2, const Param ¶m) |
| void | resetAlignment () |
| Resets alignment_. | |
| Size | getAlignmentSize () |
| Returns the number of aligned pairs of peaks. | |
| double | getAlignmentScore () const |
| Returns the score of the alignment. | |
| std::vector< std::pair< Size, Size > > | getAlignedPeaksIndices () |
| Returns aligned_peaks_indices_. | |
| void | activateSpectrum (Size index, bool repaint=true) |
Sets current spectrum index of current layer to index. | |
| void | setCurrentLayerPeakPenStyle (Qt::PenStyle ps) |
| Set's the Qt PenStyle of the active layer. | |
| void | paint (QPainter *paint_device, QPaintEvent *e) |
| Actual painting takes place here. | |
| void | setDrawInterestingMZs (bool enable) |
| interesting (e.g., high-intensity) get live annotated with m/s's | |
| bool | isDrawInterestingMZs () const |
| Return true if interesting m/s are annotated. | |
| void | setIonLadderVisible (bool show) |
| bool | isIonLadderVisible () const |
| const Gravitator & | getGravitator () const |
| Get gravity manipulation object to apply gravity to points. | |
| Public Member Functions inherited from PlotCanvas | |
| PlotCanvas (const Param &preferences, QWidget *parent=nullptr) | |
| Default constructor. | |
| ~PlotCanvas () override | |
| Destructor. | |
| void | setPlotWidget (PlotWidget *widget) |
| Sets the spectrum widget. | |
| PlotWidget * | getPlotWidget () const |
| Returns the spectrum widget. | |
| Int | getActionMode () const |
| Returns the action mode. | |
| IntensityModes | getIntensityMode () const |
| Returns the intensity mode. | |
| void | setIntensityMode (IntensityModes mod) |
| Sets the intensity mode. | |
| bool | gridLinesShown () const |
| Returns if the grid is currently shown. | |
| const LayerDataBase & | getLayer (Size index) const |
returns the layer data with index index | |
| LayerDataBase & | getLayer (Size index) |
returns the layer data with index index | |
| const LayerDataBase & | getCurrentLayer () const |
| returns the layer data of the active layer | |
| LayerDataBase & | getCurrentLayer () |
| returns the layer data of the active layer | |
| Size | getCurrentLayerIndex () const |
| returns the index of the active layer | |
| bool | getLayerFlag (LayerDataBase::Flags f) const |
| returns a layer flag of the current layer | |
| void | setLayerFlag (LayerDataBase::Flags f, bool value) |
| sets a layer flag of the current layer | |
| bool | getLayerFlag (Size layer, LayerDataBase::Flags f) const |
returns a layer flag of the layer layer | |
| void | setLayerFlag (Size layer, LayerDataBase::Flags f, bool value) |
sets a layer flag of the layer layer | |
| void | setLabel (LayerDataBase::LabelType label) |
| const VisibleArea & | getVisibleArea () const |
| Returns the currently visible area. This is the authority which determines the X and Y axis' scale. | |
| bool | isVisible (const PointOnAxis &p) const |
| PixelArea | getPixelRange () const |
| virtual void | initFilters (const DataFilters &filters) |
| Sets filters, but does not repaint (useful when setting up a new layer) | |
| virtual void | setFilters (const DataFilters &filters) |
| Sets the filters applied to the data; and redraws. | |
| Size | getLayerCount () const |
| Returns the number of layers. | |
| virtual void | activateLayer (Size layer_index)=0 |
| change the active layer (the one that is used for selecting and so on) | |
| virtual void | removeLayer (Size layer_index)=0 |
removes the layer with index layer_index | |
| void | removeLayers () |
| removes all layers by calling removeLayer() for all layer indices (from highest to lowest) | |
| bool | addLayer (std::unique_ptr< LayerData1DBase > layer) |
| Add an already constructed layer (e.g. for projections) | |
| bool | addPeakLayer (const ExperimentSharedPtrType &map, ODExperimentSharedPtrType od_map, const std::string &filename="", const std::string &caption="", const bool use_noise_cutoff=false) |
| Add a peak data layer. | |
| bool | addChromLayer (const ExperimentSharedPtrType &map, ODExperimentSharedPtrType od_map, const std::string &filename="", const std::string &caption="") |
| Add a chrom data layer. | |
| bool | addLayer (FeatureMapSharedPtrType map, const std::string &filename="", const std::string &caption="") |
| Add a feature data layer. | |
| bool | addLayer (ConsensusMapSharedPtrType map, const std::string &filename="", const std::string &caption="") |
| Add a consensus feature data layer. | |
| bool | addLayer (PeptideIdentificationList &peptides, const std::string &filename="", const std::string &caption="") |
| Add an identification data layer. | |
| float | getCurrentMinIntensity () const |
| Returns the minimum intensity of the active layer. | |
| float | getCurrentMaxIntensity () const |
| Returns the maximum intensity of the active layer. | |
| float | getMinIntensity (Size index) const |
Returns the minimum intensity of the layer with index index. | |
| float | getMaxIntensity (Size index) const |
Returns the maximum intensity of the layer with index index. | |
| void | setLayerName (Size i, const std::string &name) |
Sets the name of layer i. | |
| std::string | getLayerName (Size i) |
Gets the name of layer i. | |
| void | setCurrentLayerParameters (const Param ¶m) |
| Sets the parameters of the current layer. | |
| double | getSnapFactor () |
| Returns the first intensity scaling factor for 'snap to maximum intensity mode' (for the currently visible data range). | |
| double | getPercentageFactor () const |
| Returns the percentage factor. | |
| virtual void | showMetaData (bool modifiable=false, Int index=-1) |
| Shows a dialog with the meta data. | |
| Public Member Functions inherited from DefaultParamHandler | |
| DefaultParamHandler (const std::string &name) | |
| Constructor with name that is displayed in error messages. | |
| DefaultParamHandler (const DefaultParamHandler &rhs) | |
| Copy constructor. | |
| virtual | ~DefaultParamHandler () |
| Destructor. | |
| DefaultParamHandler & | operator= (const DefaultParamHandler &rhs) |
| Assignment operator. | |
| virtual bool | operator== (const DefaultParamHandler &rhs) const |
| Equality operator. | |
| void | setParameters (const Param ¶m) |
| Sets the parameters. | |
| const Param & | getParameters () const |
| Non-mutable access to the parameters. | |
| const Param & | getDefaults () const |
| Non-mutable access to the default parameters. | |
| const std::string & | getName () const |
| Non-mutable access to the name. | |
| void | setName (const std::string &name) |
| Mutable access to the name. | |
| const std::vector< std::string > & | getSubsections () const |
| Non-mutable access to the registered subsections. | |
Static Public Attributes | |
| static constexpr double | TOP_MARGIN {1.09} |
| extra empty margin added on top to ensure annotations and 100% y-axis label are properly drawn | |
Protected Slots | |
| void | currentLayerParamtersChanged_ () |
| Reacts on changed layer parameters. | |
| Protected Slots inherited from PlotCanvas | |
| void | updateCursor_ () |
| Updates the cursor according to the current action mode. | |
Protected Member Functions | |
| void | dataToWidget_ (double x, double y, QPoint &point) |
| Convert chart to widget coordinates. | |
| void | dataToWidget_ (const DPosition< 2 > &xy, QPoint &point) |
| QPoint | dataToWidget_ (const DPosition< 2 > &xy) |
| bool | finishAdding_ () override |
| Method that is called when a new layer has been added. | |
| void | drawCoordinates_ (QPainter &painter, const PeakIndex &peak) |
| Draws the coordinates (or coordinate deltas) to the widget's upper left corner. | |
| void | drawDeltas_ (QPainter &painter, const PeakIndex &start, const PeakIndex &end) |
| Draws the coordinates (or coordinate deltas) to the widget's upper left corner. | |
| void | drawAlignment_ (QPainter &painter) |
Draws the alignment on painter. | |
| void | changeVisibleArea1D_ (const UnitRange &new_area, bool repaint, bool add_to_stack) |
| internal method, called before calling parent function PlotCanvas::changeVisibleArea_ | |
| void | changeVisibleArea_ (VisibleArea new_area, bool repaint=true, bool add_to_stack=false) override |
| Sets the visible area. | |
| void | changeVisibleArea_ (const AreaXYType &new_area, bool repaint=true, bool add_to_stack=false) |
| Changes visible area interval. | |
| void | changeVisibleArea_ (const UnitRange &new_area, bool repaint=true, bool add_to_stack=false) |
| Changes visible area interval. | |
| void | drawHighlightedPeak_ (Size layer_index, const PeakIndex &peak, QPainter &painter, bool draw_elongation=false) |
| Draws a highlighted peak; if draw_elongation is true, the elongation line is drawn (for measuring) | |
| void | resetZoom (bool repaint=true) override |
| Zooms fully out and resets the zoom stack. | |
| void | recalculatePercentageFactor_ (Size layer_index) |
| Recalculates the current scale factor based on the specified layer (= 1.0 if intensity mode != IM_PERCENTAGE) | |
| void | recalculateRanges_ () override |
| Recalculates the overall_data_range_ (by calling PlotCanvas::recalculateRanges_) plus the overall_data_range_1d_ (which only takes into account the current spec/chrom/.. of all layers) | |
| void | updateScrollbars_ () override |
| Updates the scroll bars. | |
| void | intensityModeChange_ () override |
| This method is called whenever the intensity mode changes. Reimplement if you need to react on such changes. | |
| RangeAllType | correctGravityAxisOfVisibleArea_ (UnitRange area) |
| Protected Member Functions inherited from PlotCanvas | |
| void | resizeEvent (QResizeEvent *e) override |
| void | wheelEvent (QWheelEvent *e) override |
| void | keyPressEvent (QKeyEvent *e) override |
| void | keyReleaseEvent (QKeyEvent *e) override |
| void | focusOutEvent (QFocusEvent *e) override |
| void | leaveEvent (QEvent *e) override |
| void | enterEvent (QEnterEvent *e) override |
| void | dimensionsChanged_ () |
| Call this whenever the DimMapper receives new dimensions; will update the axes and scrollbars. | |
| virtual void | recalculateSnapFactor_ () |
| Recalculates the intensity scaling factor for 'snap to maximum intensity mode'. | |
| void | zoomBack_ () |
| Go backward in zoom history. | |
| void | zoomAdd_ (const VisibleArea &area) |
| Add a visible area to the zoom stack. | |
| void | zoomClear_ () |
| Clears the zoom stack and invalidates the current zoom position. After calling this, a valid zoom position has to be added immediately. | |
| PointXYType | widgetToData_ (double x, double y) |
| Convert widget (pixel) to chart (unit) coordinates. | |
| PointXYType | widgetToData_ (const QPoint &pos) |
Calls widgetToData_ with x and y position of pos. | |
| virtual void | update_ (const char *caller_name) |
| Updates the displayed data. | |
| void | modificationStatus_ (Size layer_index, bool modified) |
| Takes all actions necessary when the modification status of a layer changes (signals etc.) | |
| void | addDataProcessing_ (PeakMap &map, DataProcessing::ProcessingAction action) const |
| Data processing setter for peak maps. | |
| void | drawText_ (QPainter &painter, const QStringList &text) |
| Draws several lines of text to the upper right corner of the widget. | |
| double | getIdentificationMZ_ (const Size layer_index, const PeptideIdentification &peptide) const |
| Returns the m/z value of an identification depending on the m/z source of the layer (precursor mass/theoretical peptide mass) | |
| void | popIncompleteLayer_ (const QString &error_message="") |
| Protected Member Functions inherited from DefaultParamHandler | |
| virtual void | updateMembers_ () |
| This method is used to update extra member variables at the end of the setParameters() method. | |
| void | defaultsToParam_ () |
| Updates the parameters after the defaults have been set in the constructor. | |
Reimplemented QT events | |
| class | Painter1DChrom |
| class | Painter1DPeak |
| class | Painter1DIonMobility |
| RangeType | overall_data_range_1d_ |
| The data range (m/z, RT and intensity) of the current(!) spec/chrom for all layers. | |
| std::vector< DrawModes > | draw_modes_ |
| Draw modes (for each layer) - sticks or connected lines. | |
| std::vector< Qt::PenStyle > | peak_penstyle_ |
| Draw style (for each layer) | |
| QPoint | measurement_start_point_px_ |
| start point of "ruler" in pixel coordinates for measure mode | |
| bool | mirror_mode_ = false |
| Indicates whether this widget is currently in mirror mode. | |
| bool | moving_annotations_ = false |
| Indicates whether annotation items are just being moved on the canvas. | |
| bool | show_alignment_ = false |
| Indicates whether an alignment is currently visualized. | |
| Size | alignment_layer_1_ |
| Layer index of the first alignment layer. | |
| Size | alignment_layer_2_ |
| Layer index of the second alignment layer. | |
| std::vector< std::pair< double, double > > | aligned_peaks_mz_delta_ |
| Stores the alignment as MZ values of pairs of aligned peaks in both spectra. | |
| std::vector< std::pair< Size, Size > > | aligned_peaks_indices_ |
| Stores the peak indices of pairs of aligned peaks in both spectra. | |
| double | alignment_score_ = 0.0 |
| Stores the score of the last alignment. | |
| bool | ion_ladder_visible_ = true |
| whether the ion ladder is displayed on the top right corner in ID view | |
| bool | draw_interesting_MZs_ = false |
| annotate interesting peaks with m/z's | |
| QTextDocument | text_box_content_ |
| The text box in the upper left corner with the current data coordinates of the cursor. | |
| Gravitator | gr_ |
| handles pulling/pushing of points to the edges of the widget | |
| void | paintEvent (QPaintEvent *e) override |
| void | mousePressEvent (QMouseEvent *e) override |
| void | mouseReleaseEvent (QMouseEvent *e) override |
| void | mouseMoveEvent (QMouseEvent *e) override |
| void | keyPressEvent (QKeyEvent *e) override |
| void | contextMenuEvent (QContextMenuEvent *e) override |
| void | zoomForward_ () override |
| Go forward in zoom history. | |
| void | zoom_ (int x, int y, bool zoom_in) override |
| Zooms such that screen point x, y would still point to the same data point. | |
| void | translateLeft_ (Qt::KeyboardModifiers m) override |
| Translation bound to the 'Left' key. | |
| void | translateRight_ (Qt::KeyboardModifiers m) override |
| Translation bound to the 'Right' key. | |
| void | translateForward_ () override |
| Translation bound to the 'Up' key. | |
| void | translateBackward_ () override |
| Translation bound to the 'Down' key. | |
| void | paintGridLines_ (QPainter &painter) override |
| Helper function to paint grid lines. | |
| PeakIndex | findPeakAtPosition_ (QPoint) |
| Find peak next to the given position. | |
| void | addUserLabelAnnotation_ (const QPoint &screen_position) |
| Shows dialog and calls addLabelAnnotation_. | |
| void | addLabelAnnotation_ (const QPoint &screen_position, const QString &label_text) |
| Adds an annotation item at the given screen position. | |
| void | addUserPeakAnnotation_ (PeakIndex near_peak) |
| Shows dialog and calls addPeakAnnotation_. | |
| void | ensureAnnotationsWithinDataRange_ () |
| Ensure that all annotations are within data range. | |
Additional Inherited Members | |
| Static Public Member Functions inherited from DefaultParamHandler | |
| static void | writeParametersToMetaValues (const Param &write_this, MetaInfoInterface &write_here, const std::string &key_prefix="") |
| Writes all parameters to meta values. | |
| Protected Attributes inherited from PlotCanvas | |
| QImage | buffer_ |
| Buffer that stores the actual peak information. | |
| DimMapper< 2 > | unit_mapper_ |
| Mapper for X and Y axis. | |
| ActionModes | action_mode_ = AM_TRANSLATE |
| Stores the current action mode (Pick, Zoom, Translate) | |
| IntensityModes | intensity_mode_ = IM_NONE |
| Stores the used intensity mode function. | |
| LayerStack | layers_ |
| Layer data. | |
| VisibleArea | visible_area_ |
| Stores the currently visible area in data units (e.g. seconds, m/z, intensity etc) and axis (X,Y) area. | |
| RangeType | overall_data_range_ |
| Stores the data range (m/z, RT and intensity) of all layers. | |
| bool | show_grid_ = true |
| Stores whether or not to show a grid. | |
| std::vector< VisibleArea > | zoom_stack_ |
| The zoom stack. | |
| std::vector< VisibleArea >::iterator | zoom_pos_ = zoom_stack_.end() |
| The current position in the zoom stack. | |
| bool | update_buffer_ = false |
| Whether to recalculate the data in the buffer when repainting. | |
| PlotWidget * | spectrum_widget_ = nullptr |
| Back-pointer to the enclosing spectrum widget. | |
| QPoint | last_mouse_pos_ |
| start position of mouse actions | |
| double | percentage_factor_ = 1.0 |
| Intensity scaling factor for relative scale with multiple layers. | |
| std::vector< double > | snap_factors_ |
| Intensity scaling factor for 'snap to maximum intensity mode'. | |
| QRubberBand | rubber_band_ |
| Rubber band for selected area. | |
| QMenu * | context_add_ = nullptr |
| External context menu extension. | |
| bool | show_timing_ = false |
| Flag that determines if timing data is printed to the command line. | |
| PeakIndex | selected_peak_ |
| selected peak | |
| PeakIndex | measurement_start_ |
| start peak of measuring mode | |
| Protected Attributes inherited from DefaultParamHandler | |
| Param | param_ |
| Container for current parameters. | |
| Param | defaults_ |
| Container for default parameters. This member should be filled in the constructor of derived classes! | |
| std::vector< std::string > | subsections_ |
| Container for registered subsections. This member should be filled in the constructor of derived classes! | |
| std::string | error_name_ |
| Name that is displayed in error messages during the parameter checking. | |
| bool | check_defaults_ |
| If this member is set to false no checking if parameters in done;. | |
| bool | warn_empty_defaults_ |
| If this member is set to false no warning is emitted when defaults are empty;. | |
Canvas for visualization of one or several spectra.
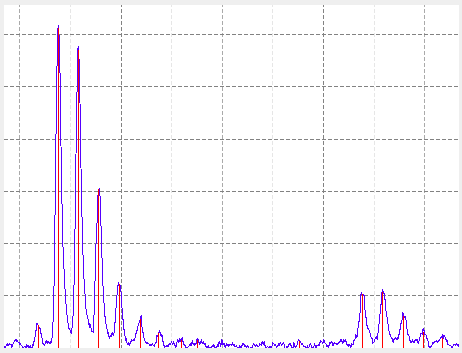
The example image shows Plot1DCanvas displaying a raw data layer and a peak data layer.
Parameters of this class are:| Name | Type | Default | Restrictions | Description |
|---|---|---|---|---|
| default_path | string | . | Default path for loading/storing data. | |
| highlighted_peak_color | string | @#ff0000 | Highlighted peak color. | |
| icon_color | string | @#000000 | Peak icon color. | |
| peak_color | string | @#0000ff | Peak color. | |
| annotation_color | string | @#000055 | Annotation color. | |
| background_color | string | @#ffffff | Background color. |
| enum DrawModes |
| enum LabelMode |
| Plot1DCanvas | ( | const Param & | preferences, |
| const DIM | gravity_axis = DIM::Y, |
||
| QWidget * | parent = nullptr |
||
| ) |
Default constructor.
|
override |
Destructor.
|
overrideslot |
| void activateSpectrum | ( | Size | index, |
| bool | repaint = true |
||
| ) |
Sets current spectrum index of current layer to index.
Referenced by TOPPViewBase::addData().
| bool addChromLayer | ( | ExperimentSharedPtrType | chrom_exp_sptr, |
| ODExperimentSharedPtrType | ondisc_sptr, | ||
| OSWDataSharedPtrType | chrom_annotation, | ||
| const int | index, | ||
| const std::string & | filename, | ||
| const std::string & | basename, | ||
| const std::string & | basename_extra | ||
| ) |
add a chromatogram layer
| [in] | chrom_exp_sptr | An MSExperiment with chromatograms |
| [in] | ondisc_sptr | OnDisk experiment, as fallback to read the chromatogram from, should chrom_exp_sptr.getChromatograms(index) be empty |
| [in] | chrom_annotation | If OSWData was loaded, pass the shared_pointer from the LayerData. Otherwise leave empty. |
| [in] | index | Index of the chromatogram to show |
| [in] | filename | For file change watcher (can be empty, if need be) |
| [in] | basename | Name of layer (usually the basename of the file) |
| [in] | basename_extra | Optional suffix of the layer name (e.g. a peptide sequence, or an index '[39]). |
|
protected |
Adds an annotation item at the given screen position.
| Annotation1DItem * addPeakAnnotation | ( | const PeakIndex & | peak_index, |
| const QString & | text, | ||
| const QColor & | color | ||
| ) |
--— Annotations
Add an annotation item for the given peak
|
protected |
Shows dialog and calls addLabelAnnotation_.
|
protected |
Shows dialog and calls addPeakAnnotation_.
|
protected |
internal method, called before calling parent function PlotCanvas::changeVisibleArea_
|
protected |
Changes visible area interval.
This method is for convenience only. It calls changeVisibleArea_(const VisibleArea&, bool, bool) .
|
protected |
Changes visible area interval.
This method is for convenience only. It calls changeVisibleArea_(const VisibleArea&, bool, bool) .
|
overrideprotectedvirtual |
Sets the visible area.
Changes the visible area, adjusts the zoom stack and notifies interested clients about the change. If the area is outside the overall data range, the new area is pushed back into the overall range.
| [in] | new_area | The new visible area. |
| [in] | repaint | If true, a complete repaint is forced. |
| [in] | add_to_stack | If true the new area is to add to the zoom_stack_. |
Reimplemented from PlotCanvas.
|
overrideprotected |
|
protected |
Adjust the gravity axis (usually y-axis with intensity) according to the given range on the x-axis (since the user cannot freely choose the limits of this axis in 1D View)
|
protectedslot |
Reacts on changed layer parameters.
| void dataToWidget | ( | const DPosition< 2 > & | peak, |
| QPoint & | point, | ||
| bool | flipped = false |
||
| ) |
For convenience - calls dataToWidget.
Referenced by Annotation1DCaret< DataPoint >::draw(), and Annotation1DPeakItem< DataPoint >::draw().
For convenience - calls dataToWidget.
| void dataToWidget | ( | double | x, |
| double | y, | ||
| QPoint & | point, | ||
| bool | flipped = false |
||
| ) |
Calls PlotCanvas::dataToWidget_(), takes mirror mode into account.
|
inlineprotected |
|
inlineprotected |
|
inlineprotected |
Convert chart to widget coordinates.
Translates chart (unit) coordinates to widget (pixel) coordinates.
| [in] | x | the chart coordinate x |
| [in] | y | the chart coordinate y |
| [out] | point | returned widget coordinates |
|
inline |
converts a distance in axis values to pixel values
|
protected |
Draws the alignment on painter.
|
protected |
Draws the coordinates (or coordinate deltas) to the widget's upper left corner.
Draws the coordinates (or coordinate deltas) to the widget's upper left corner.
|
protected |
Draws a highlighted peak; if draw_elongation is true, the elongation line is drawn (for measuring)
|
protected |
Ensure that all annotations are within data range.
|
protected |
Find peak next to the given position.
|
overrideprotectedvirtual |
Method that is called when a new layer has been added.
Implements PlotCanvas.
| void flipLayer | ( | Size | index | ) |
Flips the layer with index up/downwards.
| bool flippedLayersExist | ( | ) |
Returns whether flipped layers exist or not.
| double getAlignmentScore | ( | ) | const |
Returns the score of the alignment.
Referenced by TOPPViewBase::showSpectrumAlignmentDialog().
| Size getAlignmentSize | ( | ) |
Returns the number of aligned pairs of peaks.
Referenced by TOPPViewBase::showSpectrumAlignmentDialog().
| LayerData1DBase & getCurrentLayer | ( | ) |
returns the layer data of the active layer
| std::bad_cast | exception if the current layer is not a LayerData1DBase |
| const LayerData1DBase & getCurrentLayer | ( | ) | const |
returns the layer data of the active layer
| std::bad_cast | exception if the current layer is not a LayerData1DBase |
|
inlineoverridevirtual |
overload to call the 1D version (which has min-intensity of '0')
Reimplemented from PlotCanvas.
| DrawModes getDrawMode | ( | ) | const |
Returns the draw mode of the current layer.
Referenced by TOPPViewBase::updateToolBar().
|
inline |
Get gravity manipulation object to apply gravity to points.
Referenced by Annotation1DPeakItem< DataPoint >::draw().
| const DimBase & getGravityDim | ( | ) | const |
Get the dimension on which gravity is currently acting upon (usually it's the Y axis' unit)
| LayerData1DBase & getLayer | ( | Size | index | ) |
returns the layer data of the layer index
| std::bad_cast | exception if the current layer is not a LayerData1DBase |
| const LayerData1DBase & getLayer | ( | Size | index | ) | const |
returns the layer data of the layer index
| std::bad_cast | exception if the current layer is not a LayerData1DBase |
| const DimBase & getNonGravityDim | ( | ) | const |
Get the dimension on which gravity is currently not acting upon (the orthogonal axis; usually it's the X axis' unit)
|
overrideslot |
|
overrideprotectedvirtual |
This method is called whenever the intensity mode changes. Reimplement if you need to react on such changes.
Reimplemented from PlotCanvas.
| bool isDrawInterestingMZs | ( | ) | const |
Return true if interesting m/s are annotated.
| bool isIonLadderVisible | ( | ) | const |
|
overrideprotected |
| bool mirrorModeActive | ( | ) | const |
Returns whether this widget is currently in mirror mode.
Referenced by TOPPViewBase::showSpectrumAlignmentDialog().
|
overrideprotected |
|
overrideprotected |
|
overrideprotected |
| void paint | ( | QPainter * | paint_device, |
| QPaintEvent * | e | ||
| ) |
Actual painting takes place here.
|
overrideprotected |
|
overrideprotectedvirtual |
Helper function to paint grid lines.
Reimplemented from PlotCanvas.
--— Alignment Performs an alignment of the layers with layer_index_1 and layer_index_2
|
inline |
Pushes a data point back into the valid data range of the current layer area. Useful for annotation items which were mouse-dragged outside the range by the user.
| xy_unit | A pair (X and Y coordinate) with values in the units currently used on the axis |
| layer_index | The layer of the above data_point (to obtain the data range of the layer) |
|
inline |
Pushes a data point back into the valid data range of the current layer area. Useful for annotation items which were mouse-dragged outside the range by the user.
| T | A data point, e.g. Peak1D, which may be outside the data area |
| data_point | |
| layer_index | The layer of the above data_point (to obtain the data range of the layer) |
Referenced by Annotation1DCaret< DataPoint >::ensureWithinDataRange(), and Annotation1DPeakItem< DataPoint >::ensureWithinDataRange().
|
protected |
Recalculates the current scale factor based on the specified layer (= 1.0 if intensity mode != IM_PERCENTAGE)
|
inlineoverrideprotectedvirtual |
Recalculates the overall_data_range_ (by calling PlotCanvas::recalculateRanges_) plus the overall_data_range_1d_ (which only takes into account the current spec/chrom/.. of all layers)
A small margin is added to each side of the range in order to display all data.
Reimplemented from PlotCanvas.
References RangeManager< RangeBases >::clearRanges(), RangeManager< RangeBases >::extend(), RangeManager< RangeBases >::minSpanIfSingular(), and RangeManager< RangeBases >::scaleBy().
|
overrideslot |
| void resetAlignment | ( | ) |
Resets alignment_.
|
inlineoverrideprotectedvirtual |
Zooms fully out and resets the zoom stack.
Sets the visible area to the initial value, such that all data (for the current spec/chrom/...) is shown.
| [in] | repaint | If true a repaint is forced. Otherwise only the new area is set. |
Reimplemented from PlotCanvas.
| void setCurrentLayerPeakPenStyle | ( | Qt::PenStyle | ps | ) |
Set's the Qt PenStyle of the active layer.
| void setDrawInterestingMZs | ( | bool | enable | ) |
interesting (e.g., high-intensity) get live annotated with m/s's
| void setDrawMode | ( | DrawModes | mode | ) |
Sets draw mode of the current layer.
Referenced by TOPPViewBase::setDrawMode1D().
| void setIonLadderVisible | ( | bool | show | ) |
| void setMirrorModeActive | ( | bool | b | ) |
Sets whether this widget is currently in mirror mode.
| void setTextBox | ( | const QString & | html | ) |
Display a static text box on the top right.
|
overridevirtual |
Shows the preferences dialog of the active layer.
Implements PlotCanvas.
|
signal |
Requests to display all spectra in 2D plot.
|
signal |
Requests to display all spectra in 3D plot.
|
signal |
Requests to display all spectra as DIA.
|
signal |
Requests to display this spectrum (=frame) in ion mobility plot.
|
overrideprotectedvirtual |
Translation bound to the 'Down' key.
Reimplemented from PlotCanvas.
|
overrideprotectedvirtual |
Translation bound to the 'Up' key.
Reimplemented from PlotCanvas.
|
overrideprotectedvirtual |
Translation bound to the 'Left' key.
Reimplemented from PlotCanvas.
|
overrideprotectedvirtual |
Translation bound to the 'Right' key.
Reimplemented from PlotCanvas.
|
overrideslot |
|
overrideprotectedvirtual |
Updates the scroll bars.
Updates the scrollbars after a change of the visible area.
Reimplemented from PlotCanvas.
| PointXYType widgetToData | ( | const QPoint & | pos | ) |
For convenience - calls widgetToData.
| PointXYType widgetToData | ( | double | x, |
| double | y | ||
| ) |
Calls PlotCanvas::widgetToData_(), takes mirror mode into account.
|
inline |
compute distance in data coordinates (unit axis as shown) when moving x/y pixel in chart/widget coordinates
Referenced by Annotation1DPeakItem< DataPoint >::draw().
|
overrideprotectedvirtual |
Zooms such that screen point x, y would still point to the same data point.
Reimplemented from PlotCanvas.
|
overrideprotectedvirtual |
Go forward in zoom history.
Reimplemented from PlotCanvas.
|
friend |
|
friend |
|
friend |
Stores the peak indices of pairs of aligned peaks in both spectra.
|
protected |
Stores the alignment as MZ values of pairs of aligned peaks in both spectra.
|
protected |
Layer index of the first alignment layer.
|
protected |
Layer index of the second alignment layer.
|
protected |
Stores the score of the last alignment.
|
protected |
annotate interesting peaks with m/z's
|
protected |
Draw modes (for each layer) - sticks or connected lines.
|
protected |
handles pulling/pushing of points to the edges of the widget
|
protected |
whether the ion ladder is displayed on the top right corner in ID view
|
protected |
start point of "ruler" in pixel coordinates for measure mode
|
protected |
Indicates whether this widget is currently in mirror mode.
|
protected |
Indicates whether annotation items are just being moved on the canvas.
|
protected |
The data range (m/z, RT and intensity) of the current(!) spec/chrom for all layers.
|
protected |
Draw style (for each layer)
|
protected |
Indicates whether an alignment is currently visualized.
|
protected |
The text box in the upper left corner with the current data coordinates of the cursor.
|
staticconstexpr |
extra empty margin added on top to ensure annotations and 100% y-axis label are properly drawn
 1.9.8
1.9.8 